Debug an automation
There are several ways to debug an automation in axiom.ai. The fastest path is to read the error message, follow its recommended action, and use the in-builder debugger. When that's not enough, the Display a message and Add error metadata steps let you inspect data during a run. For background on specific errors, see common errors.
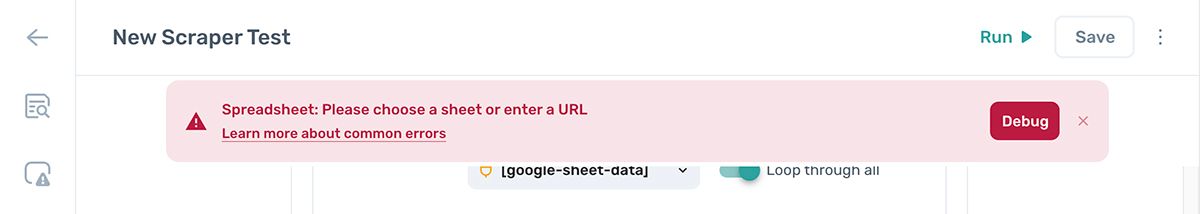
Read the in-builder error messages
When an automation hits an issue, errors and warnings appear inline in the Builder. The message describes what went wrong and often suggests how to fix it. Read these first; most issues can be resolved straight from the message.
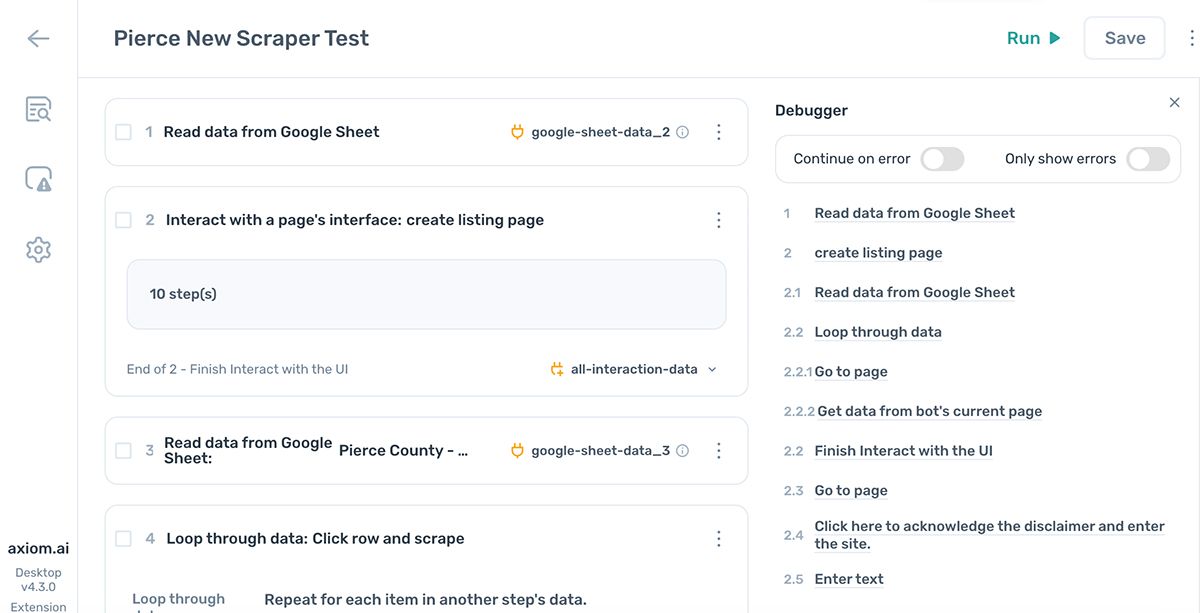
Use the debugger
Every error message includes a Debug button. Clicking it opens the debugger, which highlights the steps with issues and suggests an action to fix each one.
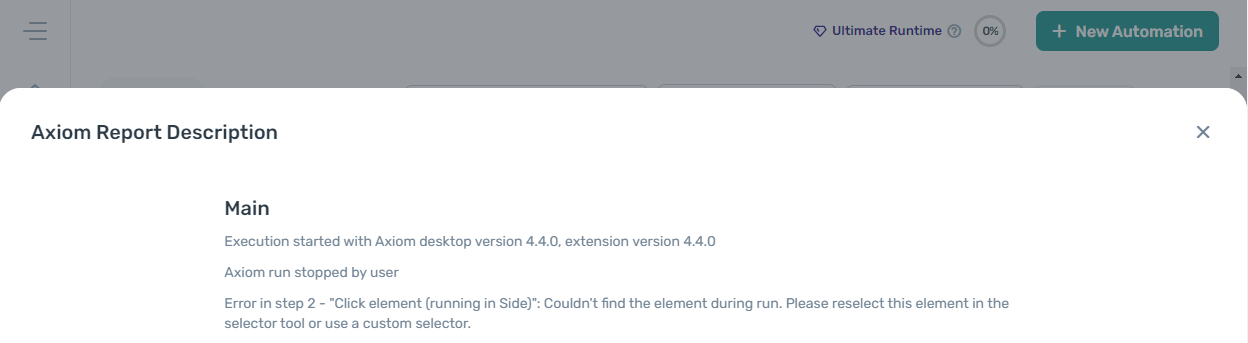
Check run reports
If you missed the in-builder message (for example, on a scheduled or cloud run), check Run reports in the dashboard. Every run is logged there with the same error and warning detail.
Watch the run
Watching the automation run is one of the most useful debugging techniques. Screen-record it if you can, then play it back to see exactly where things go wrong. While watching, look for:
- Elements missing from the page.
- The order of elements changing.
- Loading issues.
- Captchas being triggered.
Use the Display a message step
The Display a message step opens a pop-up showing the data you pass into it. Use it like a print statement to confirm what's flowing between steps.
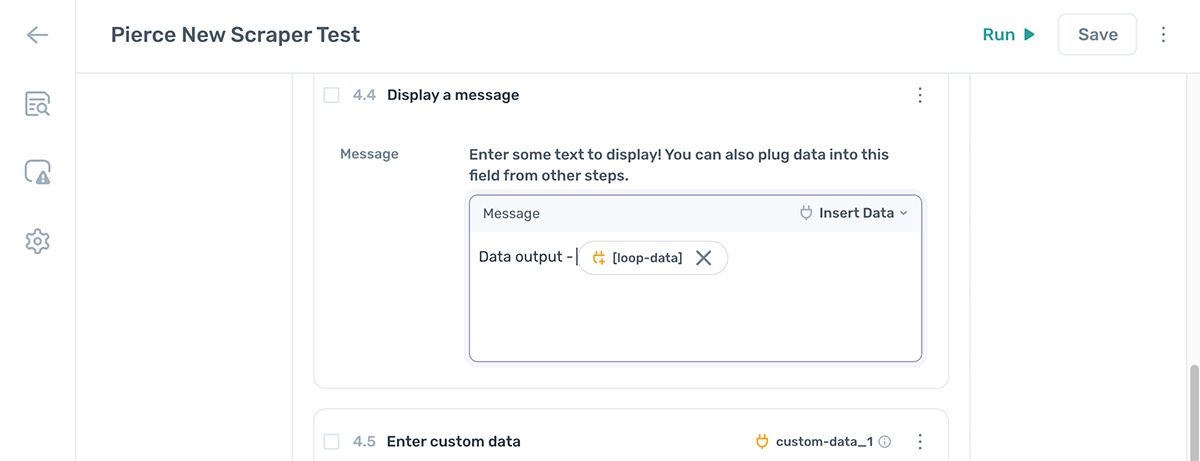
To inspect data partway through a run, open the step finder and add a Display a message step. Click Insert data and pick the variable you want to see. For example, drop a [scrape-data] token into the message after a Get data from current page step to confirm the right rows are being scraped.
Tip: Disable your Display a message steps before shipping the automation. They add pop-ups to every run and aren't needed in production.
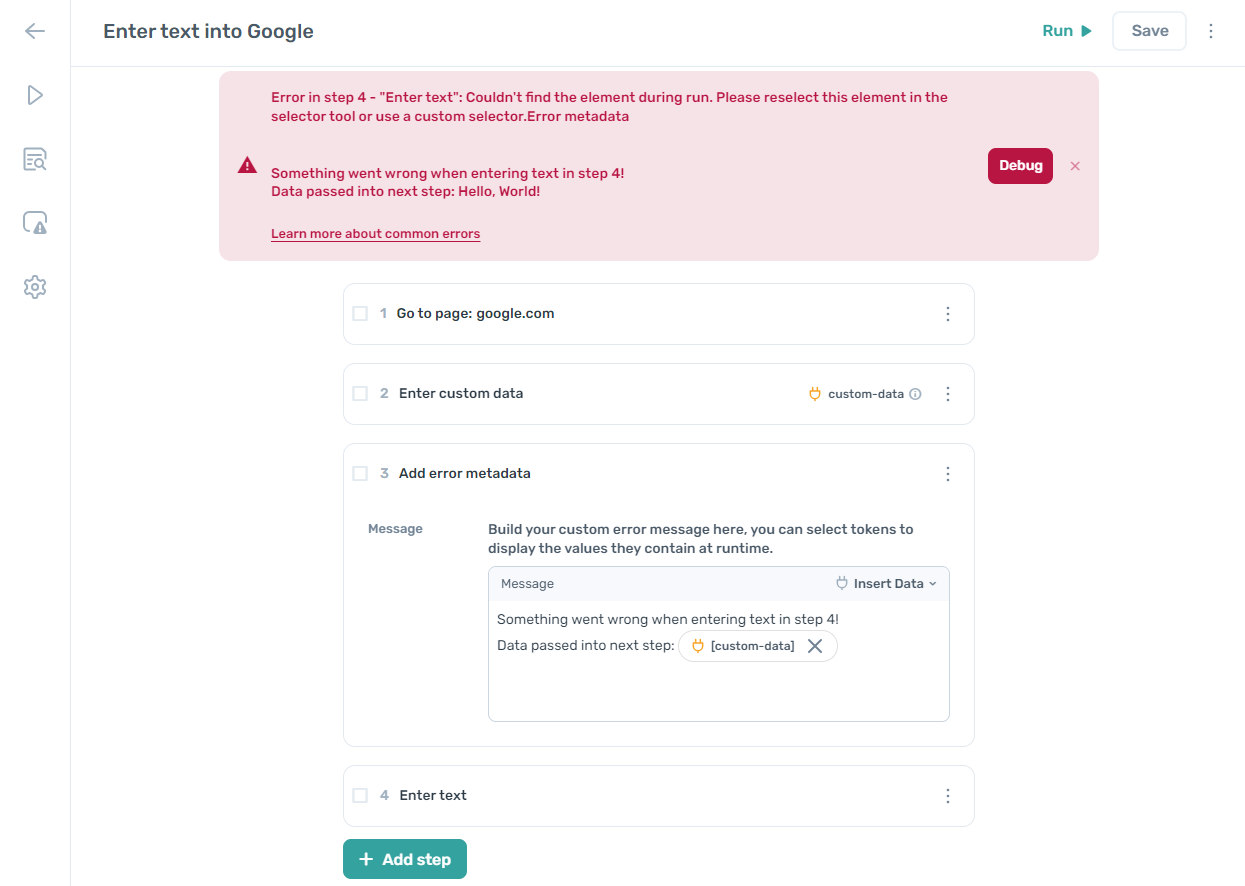
Use the Add error metadata step
The Add error metadata step attaches extra context to errors. Place it before a step that might fail, and the metadata is included in the error if that step throws.
For example, if you're passing a variable into an Enter text step and the step sometimes fails on bad input, add an Add error metadata step beforehand that includes the variable's contents. The error message then tells you exactly what value caused the failure.
Use Chrome DevTools
Chrome DevTools is built into Chrome. The Console tab shows warnings and errors from the page itself, plus anything you log from the Write javascript step.
To open DevTools, right-click the page and choose Inspect, then switch to the Console tab.
If you're debugging a Write javascript step, use console.log() inside the script to see values during the run. This can also help diagnose issues with the page itself rather than the automation.
For more on DevTools, see the Chrome DevTools documentation.
Note: DevTools is only available for desktop runs. Cloud runs close the browser when they finish, so you may need to add a Wait step at the end of the automation to keep the window open long enough to inspect the console.